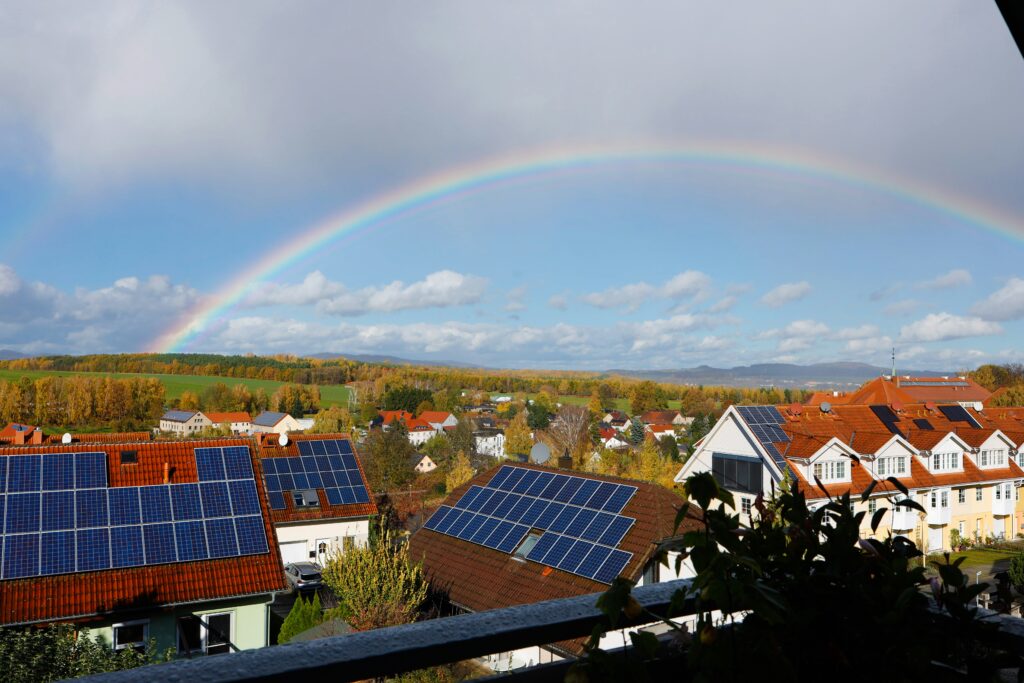

The more solar is installed, the more a single kilowatt-hour is worth depending on when it moves. On 27 September, Germany passed its entire 2025 solar output. Germany’s solar record is the best argument yet for why demand shift matters, right now. For a utility, these increasingly frequent and wide swings are either a cost you absorb or a revenue line you run. With price-led optimisation of the home batteries, heat pumps and EVs already installed in customers’ homes, utilities can choose the second.
Here is what that looks like in numbers, from our German market study on battery optimization of 50 real PV-and-battery households over twelve measured months (July 2025 to June 2026):
- Up to ~136–140 € per device and year from price-led battery optimisation alone in the direct-marketing models, compared with the same home running a price-blind self-consumption battery. Roughly 70% of that is what we actually realise across our fleet.
- ~78 € per year on top when the battery is allowed to discharge to the grid in expensive hours, with the MiSpeL cap already factored in.
- ~25 € per year saved on new fixed-tariff systems simply by not feeding in during negative-price quarter-hours, which pay nothing under the Solarspitzengesetz.
- Little of it comes out of your margin. The large feed-in share is paid by the wholesale market and, under the market premium, by the EEG account. You pass on mostly third-party money, and it ties the customer to your tariff.
Germany’s Solar Record: A full year of solar, three months early
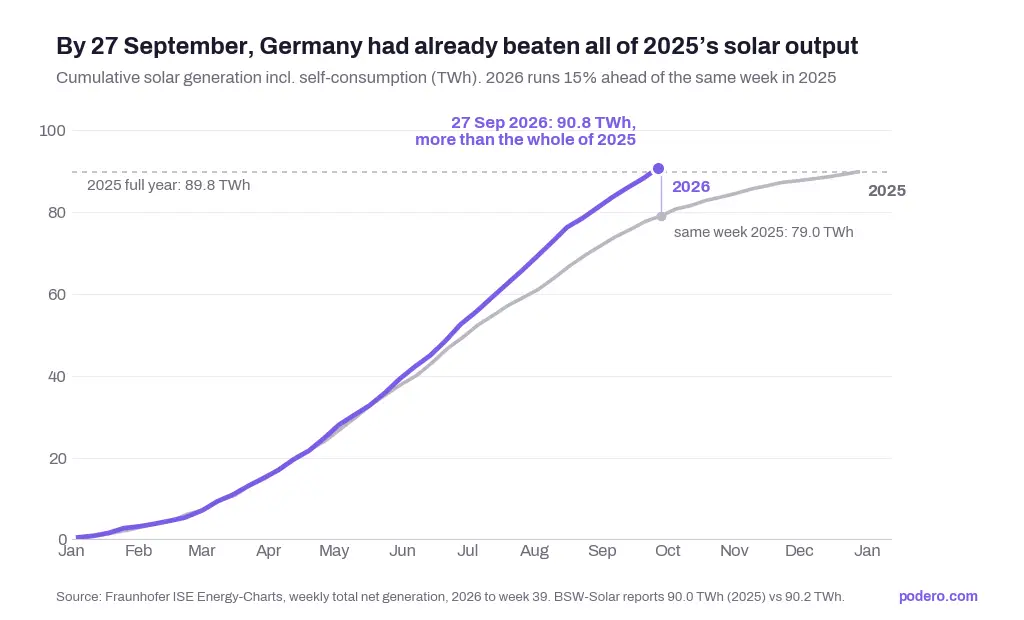
By 27 September 2026, German solar plants had produced 90.2 TWh of net electricity this year, more than the 90.0 TWh generated in all of 2025. BSW-Solar, citing Fraunhofer ISE Energy-Charts data, declared the date this year’s “Solar Day” (BSW-Solar; Clean Energy Wire).
Two things drove it: an unusually sunny year and steady capacity growth. Around 130 GWp is now installed, against a 2030 target of 215 GWp. Hitting that target means roughly 20 GW of new solar every year for the next four years.
Clean Energy Wire points to the other side of the record. Solar growth, combined with limited options for flexible demand, is putting the grid under strain. Hours where supply far exceeds demand and wholesale prices go negative are becoming more common, and so is curtailment.
Policy is moving in the same direction. The EEG 2027 draft and the “Netzpaket” had their first Bundestag reading on 24 September. The draft would remove fixed feed-in tariffs for new systems, pushing every new PV household into direct marketing from day one.
I read this as a clear signal: the record is not the story. The shape of the curve is.
What the record does to prices
Every new gigawatt of solar feeds in during the same midday hours. That shows up in the price curve first.
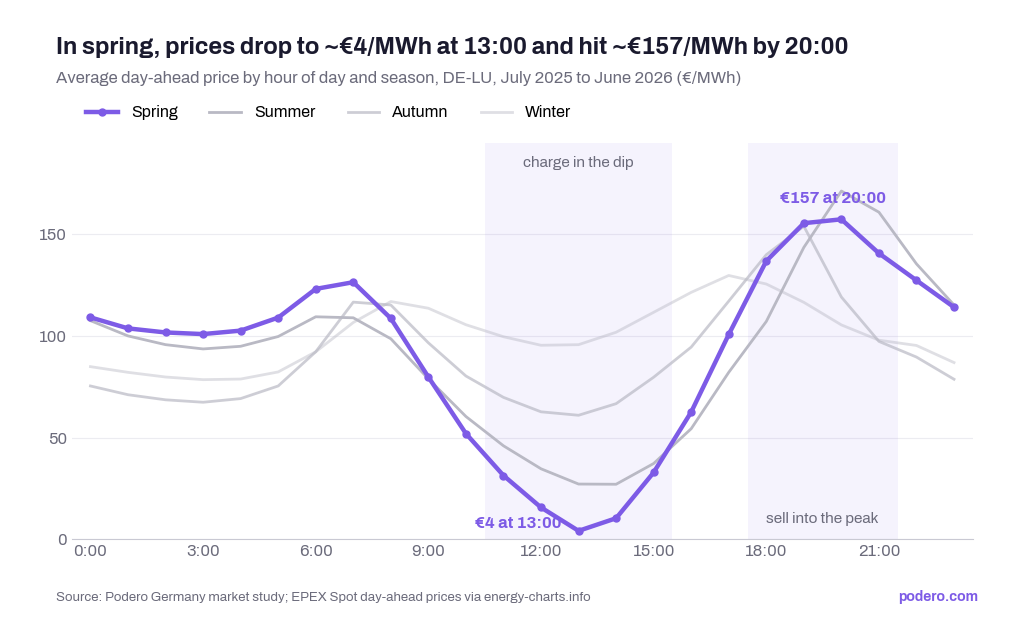
This is the arbitrage in one picture. Clustered solar feed-in pushes the midday price close to zero, while the evening peak stays above 150 €/MWh in spring, summer and autumn. Winter has almost no dip, which is why the value of optimisation is so seasonal.
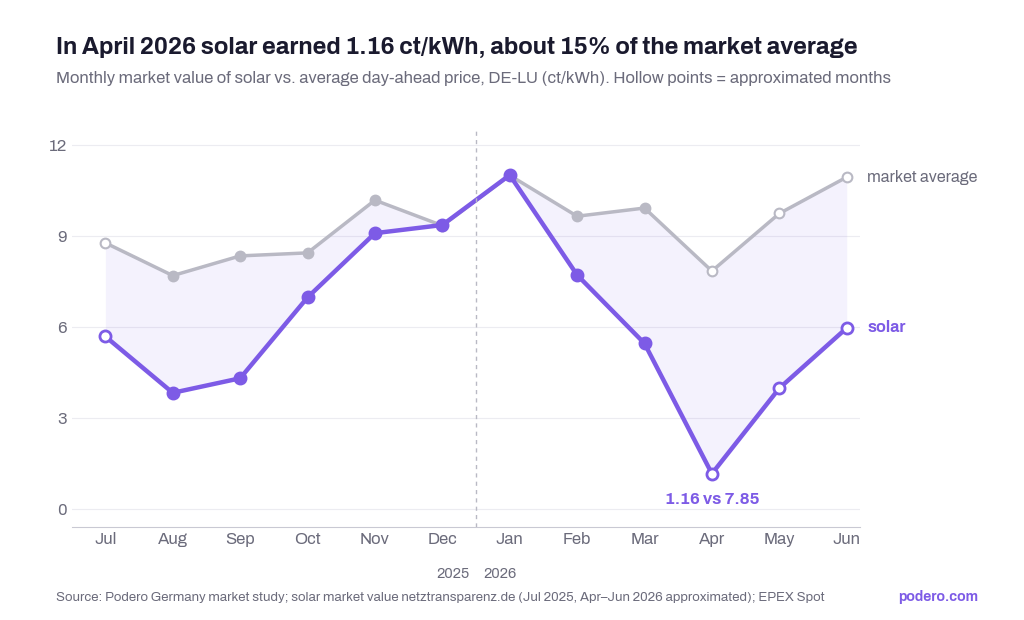
In winter, solar earns roughly the market average. From spring on, all panels feed in at the same midday hours and push down the price they are paid. This cannibalisation is structural, and it grows with every gigawatt installed. A battery that moves the feed-in into the evening sells at the upper line, not the lower one.
The key market indicators for the same period (DE-LU, July 2025 to June 2026, from the market study):
- Average day-ahead price: 93 €/MWh (monthly 77–110). The baseline the spread sits on.
- Average daily spread: 147 €/MWh. Most expensive minus cheapest hour, every day.
- Negative quarter-hours: 5.5% (1,921 intervals). Hours to hold energy back, or charge from the grid.
- German solar output, 1 January to 27 September 2026: 90.2 TWh. Already above all of 2025 (90.0 TWh).
What the volatility means for a German utility
Every midday solar peak creates two problems and one opportunity. Most utilities only see the problems.
The cost side. A price-blind home battery charges from the roof in the morning, is full by noon, and then pushes surplus into the grid exactly when prices are lowest or negative. For a new system on a fixed tariff, those negative quarter-hours now pay nothing. Your balancing group carries the imbalance risk of thousands of customers who all do the same thing at the same time.
The customer side. Around 2.3 million home batteries are installed in Germany, but direct marketing below 100 kW barely happens yet. Players like 1KOMMA5°, Enpal and Octopus Energy are moving into that gap. If the EEG 2027 draft passes as written, every new PV customer needs a direct marketer. Whoever takes the feed-in is one step away from taking the supply contract too.
The opportunity. The same price that makes consumption expensive in the evening makes feed-in valuable. A battery that charges in the midday dip and discharges into the evening peak earns on the spread. Our market study shows the value depends almost entirely on wholesale volatility, not on subsidy settings. Halving or increasing solar cannibalisation by 50% barely moves the result.
Here is what that is worth for a single home battery:
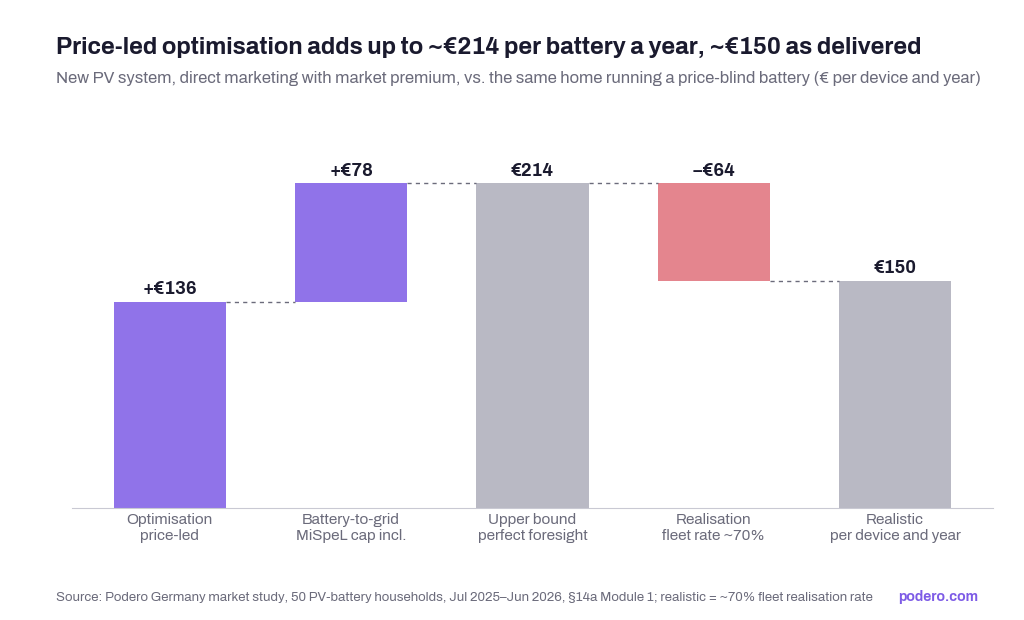
Most of the value comes from shifting energy against the daily price curve. Letting the battery discharge to the grid in expensive hours adds a second, almost as large, layer on top.
And the saving is mostly not yours to fund:
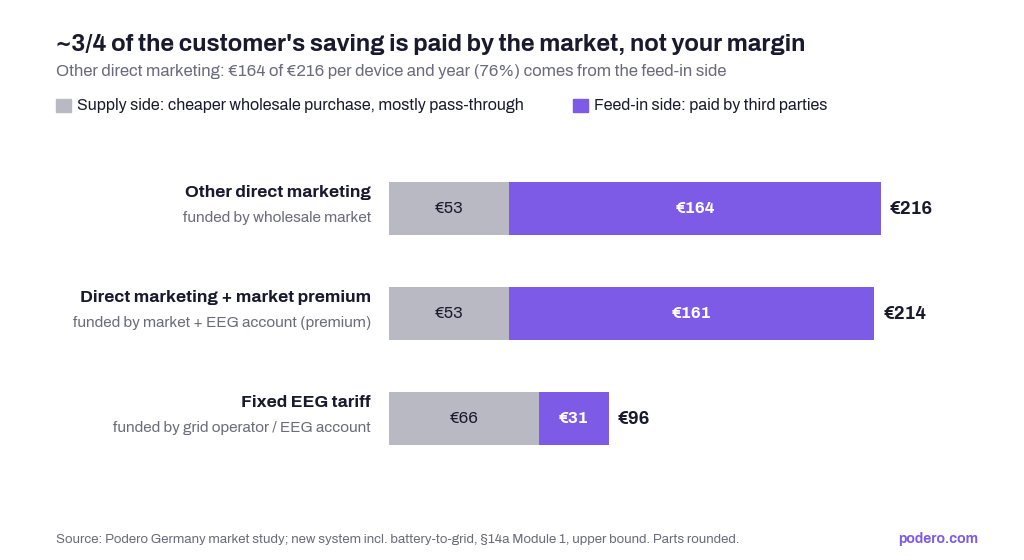
The supply-side part, about €53, is small and largely passes through: cheaper wholesale purchasing plus volume-based levies, with the trading margin practically untouched. The large feed-in part comes from the wholesale market and, with the market premium, from the EEG account. Under the fixed tariff, the grid operator pays the feed-in, not you.
Two practical points we hear most often from utilities:
- You don’t need a dynamic end-customer tariff. With a smart meter in place, the customer can stay on a fixed price while you settle and optimise dynamically in the background. We call this “Flex for Fixed”. You decide how much reaches the customer, as a flex bonus, a feed-in share or margin.
- The smart meter is both the friction and the entry ticket. At the end of 2025 only about 4% of German metering points had one. Any product has to plan the rollout in.
The revenue potential for your own portfolio can be estimated in the revenue calculator.
Why forecasting is the real differentiator
Anyone can draw a battery schedule against yesterday’s prices. The money is in delivering it. Look at the value chart above again: the gap between the upper bound and what a fleet actually earns is the gap between perfect foresight and reality. Forecasting is what closes it.
Here is why. When a utility sells a fleet’s flexibility on the day-ahead or intraday market, it commits to a delivery. If households then consume more than expected, or the sun delivers less, the fleet comes up short. That shortfall is settled at the imbalance price, and in a high-solar system those prices can be extreme.
We have seen this in our own trading. On one August evening in Austria, intraday prices spiked and our algorithm sold battery discharge into the peak, exactly as designed. On paper the day earned €5.60 per device. Then households used more of the battery energy than forecast, part of one manufacturer’s cloud went down, and imbalance prices touched almost €9,000/MWh for that hour. The fleet still closed the day in profit, at €1.41 per device. The lesson was clear: trading revenue is only as good as the forecast behind it.
What makes our forecasting different
- We forecast devices we also steer. A utility forecasting a standard load profile is guessing at behaviour it cannot see. We forecast each heat pump, battery and EV individually and know the schedule we are about to send it. In our research, the planned steering mode turned out to be by far the strongest predictor of what a heat pump does next, stronger than weather or weekday patterns. Forecast and control come from the same system, so the forecast partly makes itself true.
- Every device, every asset, bottom-up. We run separate forecasts for PV generation, household consumption and EV behaviour (plug-in probability and state of charge), per device, then aggregate them into the fleet position your trading desk sees.
- Fresh where it matters, stable where it doesn’t. Household forecasts refresh every 15 minutes for the next four hours, from live telemetry, and arrive before every quarter-hourly optimisation run. A PV nowcast rewrites the next three hours every 15 minutes as clouds move in. The longer horizon, two days and more, refreshes hourly for day-ahead bidding. EV forecasts cover 48 hours of plug-in probability and state of charge.
- Measured against your baseline, not ours. Our trading dashboard compares the steered fleet’s imbalance with the imbalance the unoptimised fleet would have caused. If steering reduces imbalance, that shows up as revenue, not just avoided cost. Your team can inspect forecast runs and accuracy per device, per hour, in the console.
This is also where the German market is heading. With fixed feed-in tariffs disappearing for new systems, every kWh a PV household exports will be sold at a market price. The utility that can forecast those kWh accurately keeps the spread. The one that can’t pays it away in imbalance.
Book a call with Benjamin
The next record will come sooner, and the midday dip will be deeper. The question for your 2027 plan is whether that volatility shows up in your P&L as imbalance cost or as a new revenue line.
In 30 minutes, I’ll walk you through three things for your own portfolio:
- What price-led optimisation is worth for your PV, battery, heat pump and EV customers, using the revenue calculator.
- How your trading desk would work with the forecasts and schedules, including how we measure imbalance against your current baseline.
- What a white-label launch looks like, from device connectivity to the first steered fleet.
Benjamin Dobberke is Team Lead Sales at Podero, where he works with utilities across DACH on flexibility and enterprise energy software. Before Podero he built the SaaS sales motion at Leaders21. He holds a Master’s in Entrepreneurship from the University of Gothenburg.
Sources
- Clean Energy Wire, German solar power generation reaches new yearly record in September, 28 September 2026
- BSW-Solar, Deutschlands Solarstromproduktion übertrifft schon im September das gesamte Vorjahr, 28 September 2026
- Fraunhofer ISE, Energy-Charts (underlying generation data)
- Podero, Germany market study: price-led storage optimisation, July 2025 to June 2026
- Podero, Revenue calculator